Earth Vis
An experiment in converting NASA climate data into a real-time VFX graph visualization. For this project, I built a system in Unity where a compute shader drives particles across a globe in polar coordinates, sampling precomputed flowmaps for wind speed and direction, while their trails change color based on temperature.
Related Projects
BEEP Energy Sim
An AR energy-use visualization that lets stakeholders view expected energy loads for every room in a heritage building over the year using a phone or tablet. A slider scrubs through a full year of data, built to explain green infrastructure investments for the adaptive reuse project. More information on the project can be found here.Technical: I baked 3D room volumes into an optimized mesh whose vertex UVs encode positions on a packed lookup texture for GPU-driven animation without CPU overhead. The project also showcased Wikar's 3D section slicer, which recomposes standard shaders into slicable equivalents using 3D SDF intersections with a stencil pass for back-face fill.
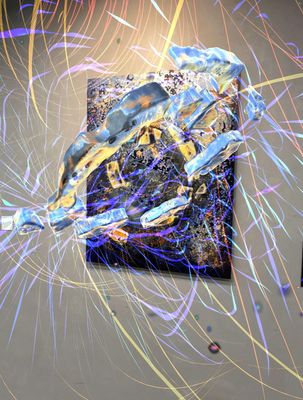
CryoLumens
An AR artwork representing the strength and location of Earth's magnetic fields using NASA's real-time sensor network, overlaying data-driven particle systems on an original painting using image tracking. When viewed through a phone, the painting comes alive with particles that shift and flow based on live magnetic field data. I developed the coding and visuals for Eli Joteva.Technical: Live sensor intensities are baked into packed textures so particles animate by interpolating a texture index on the GPU, keeping the visualization real-time without CPU overhead.
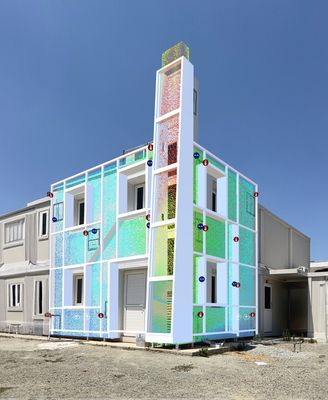
MESH AIRFLOW Visualization
An AR visualization of airflow patterns for a secondary facade system designed by the Cyprus Institute. I took the researchers' 2D computational fluid dynamics (CFD) simulations (heat and flow maps) and UV mapped them onto a 1:1 scale 3D model of the facade, then built a shader to animate these maps with particles, inspired by how Portal 2 visualizes fluid dynamics. In the final application, users scan a QR code on the test building and see the internal 'stack effect' in action, with callouts indicating sensor locations.
Minotaur
Minotaur is a digital marble maze inspired by the classic BRIO Labyrinth board game, where players tilt a board to navigate a ball around holes. It also served as my earliest experiment with embedded analytics—I built a system that records play sessions and sends summary data to a Clowder data repository. This work enabled long-term data collection, and the results from over three years and thousands of play sessions are analyzed in this report.